
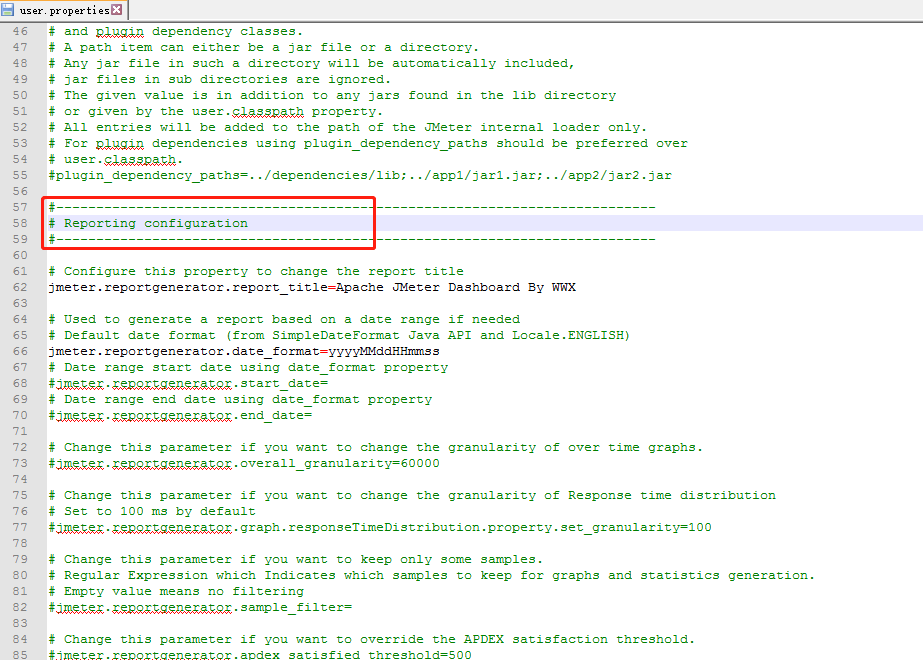
找到对应的 user.properties文件中并进行修改
14.2.1 Requirements
To enable the generator to operate, the input CSV files must include certain required data. Check that your JMeter configuration follows these settings (these are the defaults):
jmeter.save.saveservice.bytes = true# Only available with HttpClient4#jmeter.save.saveservice.sent_bytes=truejmeter.save.saveservice.label = truejmeter.save.saveservice.latency = truejmeter.save.saveservice.response_code = truejmeter.save.saveservice.response_message = truejmeter.save.saveservice.successful = truejmeter.save.saveservice.thread_counts = truejmeter.save.saveservice.thread_name = truejmeter.save.saveservice.time = truejmeter.save.saveservice.connect_time = true# the timestamp format must include the time and should include the date.# For example the default, which is milliseconds since the epoch: jmeter.save.saveservice.timestamp_format = ms# Or the following would also be suitablejmeter.save.saveservice.timestamp_format = yyyy/MM/dd HH:mm:ssThe input CSV file must include the timeStamp
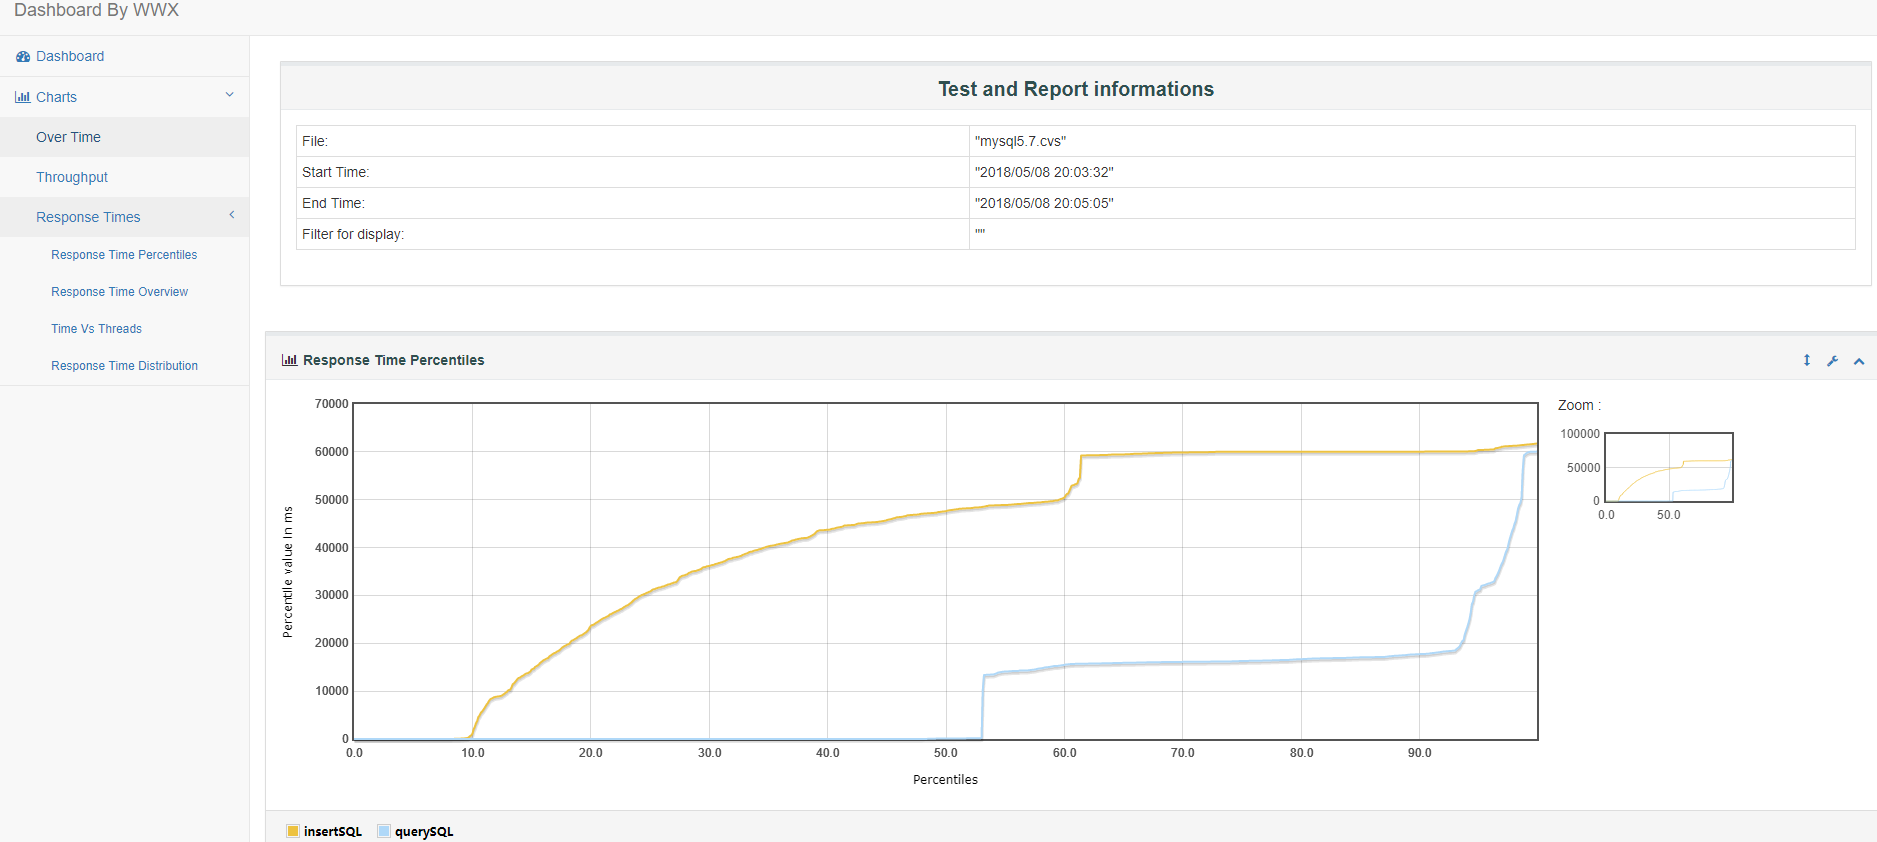
14.3 Generating reports
The report generation can be done as a stand alone process from a sample log file or automatically after running load test.
14.3.1 Generation from an existing sample CSV log file
Use the following command:
jmeter -g-o
14.3.2 Generation after load test
Use the following command:
jmeter -n -t-l -e -o
摘自:http://jmeter.apache.org/usermanual/generating-dashboard.html
聚合报告(aggregate report)
对于每个请求,它统计响应信息并提供请求数,平均值,最大,最小值,错误率,大约吞吐量(以请求数/秒为单位)和以kb/秒为单位的吞吐量.
吞吐量是以取样目标点的视角来统计的(例如:HTTP请求样例中设置的远程服务器). JMeter会把已生成请求的总响应时间考虑在内,所以,如果相同线程组中有其它取样器或定时器,将增加总时间,进而减少吞吐量的值。因此,两个仅名称不同的取样器,其吞吐量为该两个取样器吞吐量总和的一半。正确的选择取样器名字对于重聚合报告中获取最佳的结果来说很重要。
表头说明:
Label:每个 JMeter 的 element(例如 HTTP Request)都有一个 Name 属性,这里显示的就是 Name 属性的值
#Samples:表示你这次测试中一共发出了多少个请求,如果模拟10个用户,每个用户迭代10次,那么这里显示100
Average:平均响应时间——默认情况下是单个 Request 的平均响应时间,当使用了 Transaction Controller 时,也可以以Transaction 为单位显示平均响应时间
Median:中位数,也就是 50% 用户的响应时间
90% Line:90% 用户的响应时间
Note:关于 50% 和 90% 并发用户数的含义,请参考下文
http://www.cnblogs.com/jackei/archive/2006/11/11/557972.html
Min:最小响应时间
Max:最大响应时间
Error%:本次测试中出现错误的请求的数量/请求的总数
Throughput:吞吐量——默认情况下表示每秒完成的请求数(Request per Second),当使用了 Transaction Controller 时,也可以表示类似 LoadRunner 的 Transaction per Second 数
KB/Sec:每秒从服务器端接收到的数据量,相当于LoadRunner中的Throughput/Sec
注意:
1.无特别说明,以上时间的单位均为ms